M348
Applied statistical modelling
You will enjoy M348 if…
- you love exploring interesting datasets
- you want to solve practical problems by modelling
- econometrics or data science sounds fun
- you want amazing, free statistical software #rstats
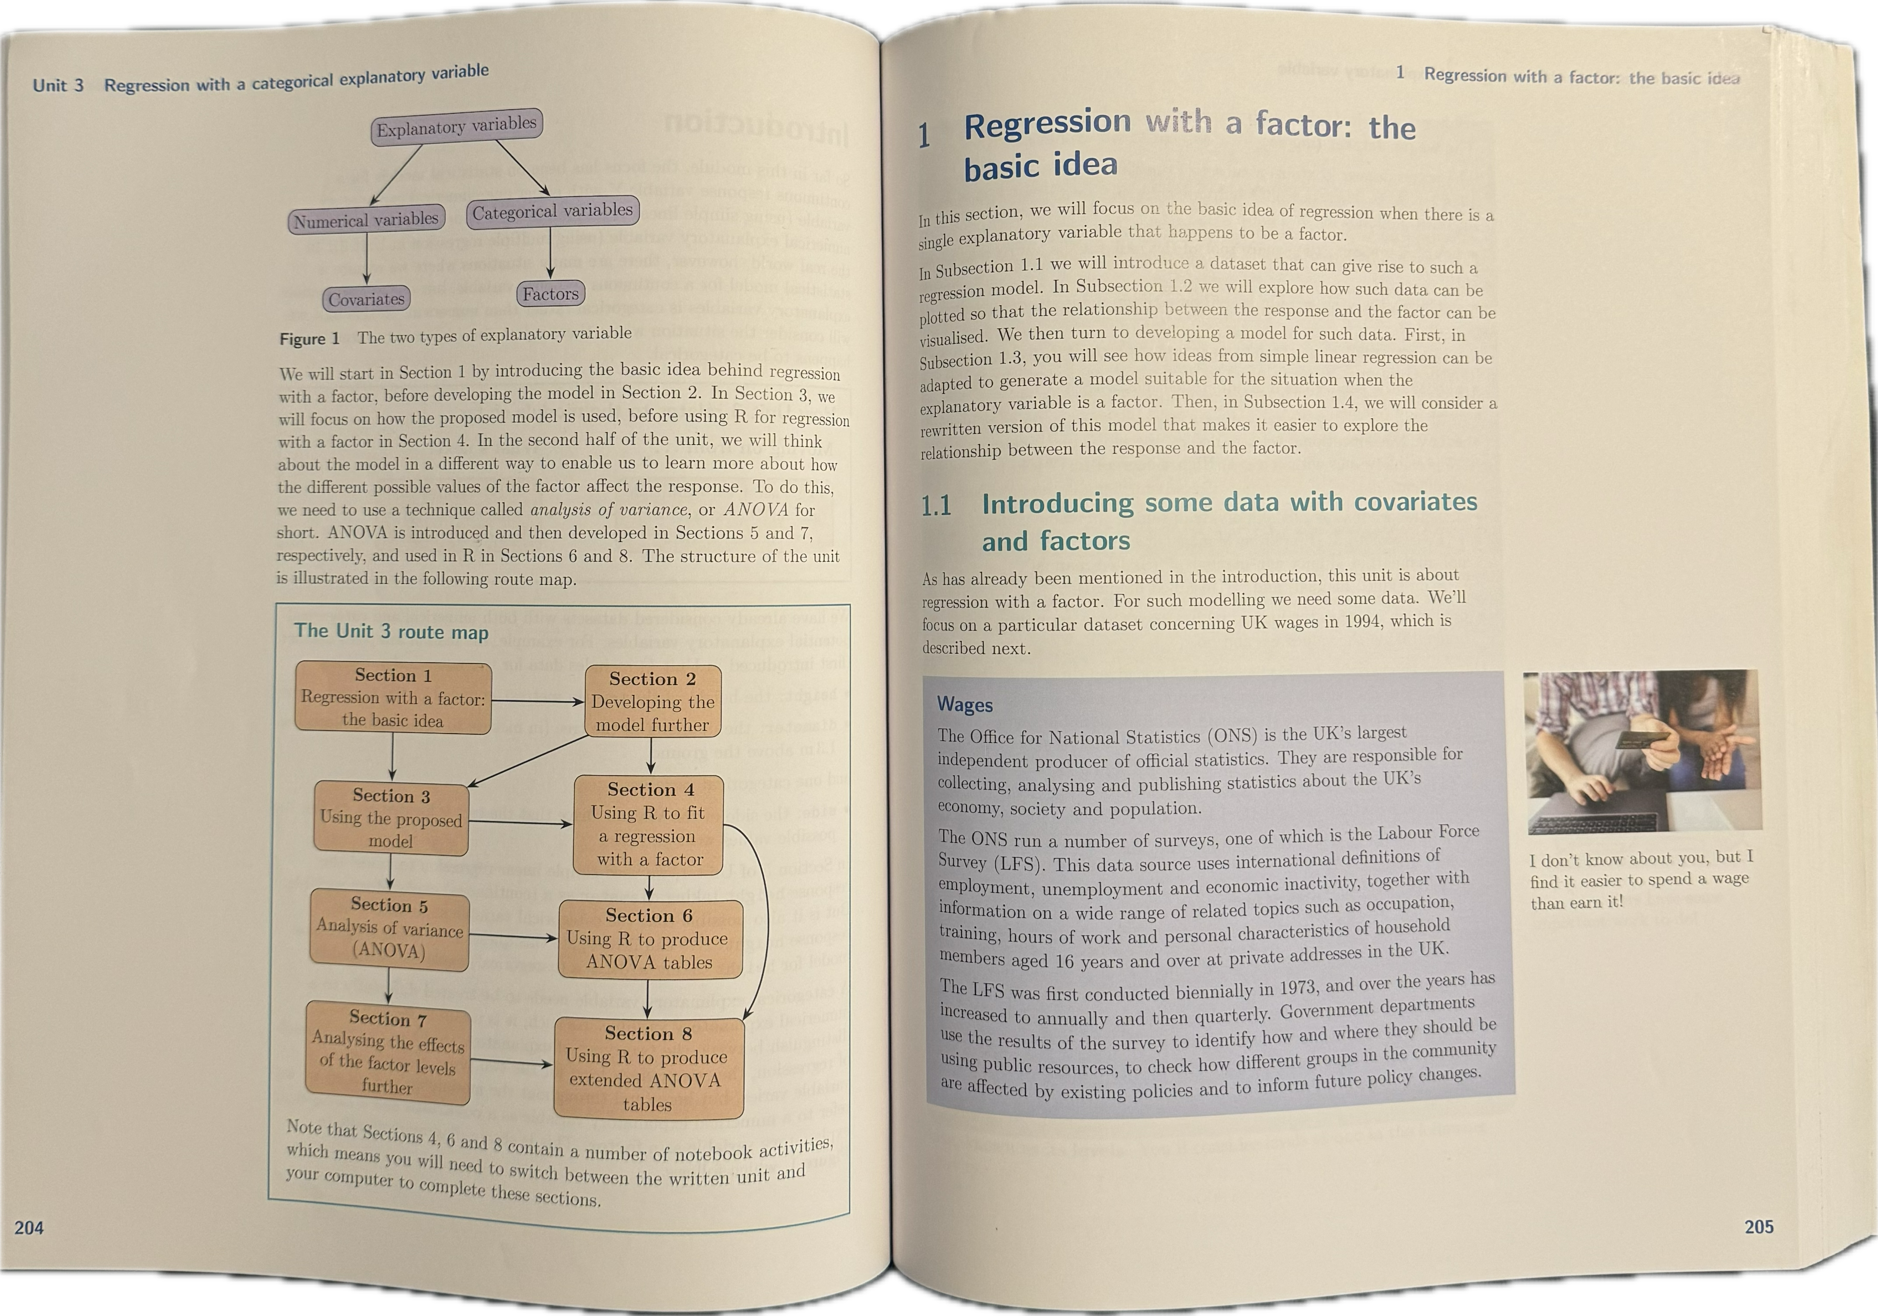
Coursebooks
Three coursebooks (including both strands!) and a handbook (click to enlarge)
Computing Environment
- R (free, open-source, first-class language 💚)
- All software runs in browser - VLE with all packages preinstalled and ready to go.

Day-in-the-life of M348

Error in eval(expr, envir, enclos): object 'mannaash' not found treeID diameter height side
Min. :236.0 Min. :0.1500 Min. : 4.000 east:11
1st Qu.:247.2 1st Qu.:0.2000 1st Qu.: 7.000 west:31
Median :258.5 Median :0.2400 Median : 8.000
Mean :257.8 Mean :0.2424 Mean : 8.024
3rd Qu.:268.8 3rd Qu.:0.2775 3rd Qu.: 9.000
Max. :279.0 Max. :0.3500 Max. :10.000 Aha!

Analysis of Variance Table

Model 1: height ~ diameter
Model 2: height ~ side + diameter
  Res.Df     RSS Df Sum of Sq    F    Pr(>F)
1     40 105.055
2     39  55.293  1    49.763 35.1 6.594e-07 ***
---
Signif. codes:  0 '***' 0.001 '**' 0.01 '*' 0.05 '.' 0.1 ' ' 1
So the formal test result is significant - confirming our intuition. We should include “side” in the model, giving two parallel slopes.
Thanks for visiting!
The tutors and students of M348 are a wonderful mix of economists, computer scientists, mathematicians… You’ll love it!


